Quantified Posture: A LumoBack Review

It haunted me. Like a weird posture peddler, the ad followed me everywhere I went online. Apparently one  visit to Lumo’s site a few months ago was enough for Google’s ad network to put a Lumo ad in front of me on what felt like every site I visited.

I probably wouldn’t even have noticed if I wasn’t already intrigued. I have wanted to fix my posture for years. When I see someone about to take a photo of me, I make a conscious effort to stand straighter. But when I see the resulting photos I still often feel like I’m not standing as tall as I would like.

And yet I hesitated. Realtime feedback aside, I like to know that I can analyze my data later and compare it with data from other sources in order to get a fuller picture and run experiments. I had read that the LumoBack API wasn’t ready, so despite promises, I was concerned that the data would be stuck in the device, not readily available for external analysis. Every now and then I would do a search for LumoBack API, and finally I found the droids I was looking for. I couldn’t get access to the API or its documentation without an account, but it was enough to make me take the plunge.

Initial Experience

Lumo is pretty good at detecting whether I’m sitting, standing, or walking, although it doesn’t always pick up on the transitions between them very quickly. I found that occasionally it would take up to 30 seconds to realize I had stood up from a sitting position. It is possible to force it to know that you’re sitting or standing with a simple swipe, which hopefully teaches it to be quicker in the future.

There are several levels of sensitivity, depending on how much you want to be able to slouch before Lumo corrects you. I went immediately to the most sensitive setting, which turns Lumo into an all-out posture Nazi. While you’re sitting, that is.

Lumo is much more strict when you are sitting than when you are standing or walking, even on the most sensitive setting. I have to lean quite a lot while I’m standing before Lumo reacts. There is likely a good reason for this; as I move through my daily life, there are times where it is certainly okay to be a little out of position. That said, it does give the perception that the realtime feedback is less useful for standing and walking posture than it is for sitting posture.

Further tests may help determine whether this perception is warranted.

Update: after another day with Lumo and some additional introspection, I’m finding that my posture concerns when sitting are primarily with my lower back, which is where the LumoBack excels. When standing, my problem is more often with the upper back/shoulders, which is outside of what Lumo primarily tracks. When walking or driving, Lumo seems to ignore posture.

Presentation

Out of the box, the presentation is nicely done. The setup instructions are simple and straightforward. The calibration is easy. No problems connecting Bluetooth to my iPhone 5 running iOS 7.0. My LumoBack model is version 3.0.5.

Car Trouble

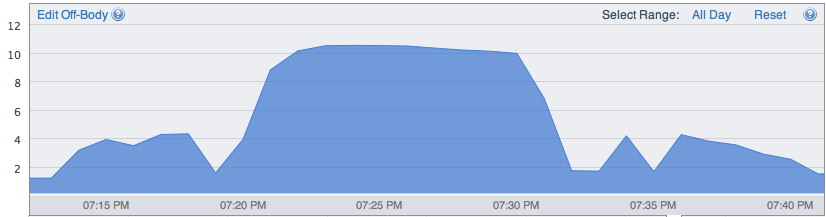
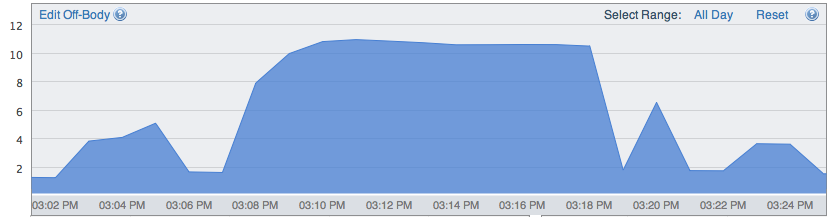
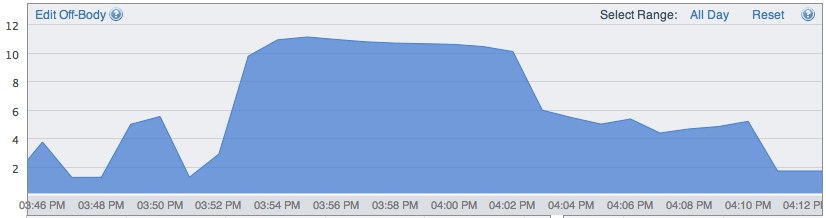
Wow. Apparently car seats are terrible for good posture. Maybe it’s just my car seat, although I did also have similar trouble in a rental car recently. Previously I thought I had my car seat set in a position that would help me to sit up better, but apparently I couldn’t have been more wrong. While I can very quickly find my good posture in a normal chair, in the car it was nearly impossible. I spent a good 5-10 minutes adjusting my car seat and my posture to get Lumo to stop burning a hole in my lower back and still couldn’t maintain a good position for more than about 30 seconds at a time.

I would have to lean forward against the seat belt and away from the back of the seat, which is curved in a way that doesn’t allow for a straight back. The whole experience was incredibly awkward and frustrating. I tried to maintain posture as best I could and adjust the seat to try to support it.

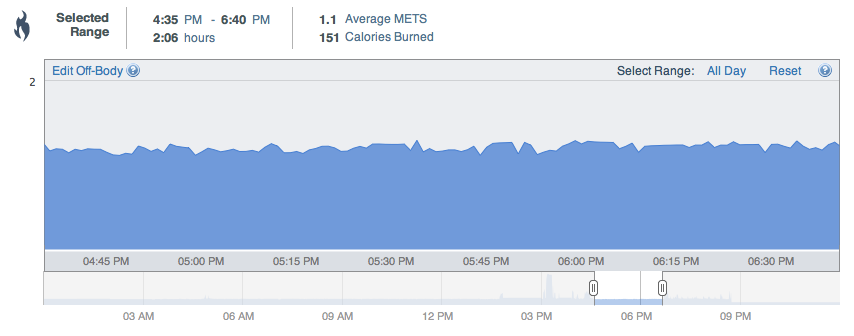
One of the more interesting and unique metrics the LumoBack has to offer is that it can automatically detect the amount of time you spend in the car. Presumably it determines this purely through accelerometer data. So before the car actually starts moving, Lumo doesn’t know you’re in a car and just assumes you’re sitting normally just like any chair.

Continue reading “Quantified Posture: A LumoBack Review” »

Experiment: Does Running in Cold Weather Make Me Burn More Calories? (Part 5)

I’ve just discovered something really interesting in my last few runs (from my Running Cold Experiment, see Part 1Part 2Part 3, Part 4) that I may not have noticed had I not implemented BodyMedia’s suggested methodology. Check this out:

Here was Trial 9 (today from 7:20-7:30, at a WARM 62ºF) with a little extra data on either side. Notice how quickly the chart falls back down to under 2 calories per minute once I stopped running at 7:30.

Trial 9 Chart

Now look at Trial 7 (4/14 from 3:08-3:18, at a WARM 61ºF). Again, notice the similar results, especially the fast dropoff after 3:18pm when I stopped running:

Trial 7 Chart

BUT now check out Trial 8 (4/19 from 3:52-4:02, at a COLD 37ºF). I stopped running at 4:02:

Trial 8 Chart

The dropoff on Trial 8 was not nearly so steep. The calorie burn continued to be elevated well after I stopped running. So although my maximum burn was not affected that much DURING the run, afterward I continued to burn calories at an accelerated rate.
These are only 3 data points, but I found this to be very interesting. It’s also something that would not show up in my regular data chart because I’m not including the cooldown data for this particular experiment. Could be something interesting to explore in the future. I just hope I get more cold days!

Biometrics of Jurassic Park 3D

Once upon a time I studied to take the SAT. To that end, I took an SAT prep class and in said class they mentioned the importance of nutrition for studying. Because, they said, the brain becomes a major calorie-consuming organ when it is taxed with difficult tests.

Assuming this was true, I wondered if the same principal would correspond with emotional, as well as intellectual, engagement. And I saw an opportunity to run an experiment:

Jurassic Park was one of the movies that had a major impact on me as a kid and influenced my decision to go to film school. But I never had a chance to see it in the theater – until now. So I wore my BodyMedia armband during a showing of Jurassic Park 3D in order to record my calorie burn.

I had this great plan. I knew that this is a movie that has a major effect on me, which I hypothesized could also have an influence on my calorie burn at different parts of the movie. So the plan was that once I got back home I would take a look at the calorie graph, find any peaks and troughs, then go back through the movie on DVD and correlate my calorie burn to different events in the movie.

The result would be a sort of “heat map” of my level of captivation with movie magic.

The bottom line:

Calorie Burn Jurassic Park 3D

…and flatline.

It turns out that if there’s one lesson I can learn from this experiment, it’s that in terms of calorie burn, sitting is sitting no matter how engaged you are in the movie!

I probably could have picked a better metric… I imagine that wearing a heart rate monitor would have revealed a graph with a bit more variability.

Also, in spite of being involved in the movie, I’ve also seen it a million times and there are no longer any surprises for me. It’s possible that surprises could have burned more calories, although heart rate is almost certainly a better way to go in the future.

It appears that the main factor affecting movie-watching calorie burn rate is whether or not you get up to go to the bathroom during the movie.

It also makes me want to wear the BodyMedia armband during the GRE or some other sedentary, high stakes testing situation to see about those brain calorie burn claims.

Experiment: Does Running in Cold Weather Make Me Burn More Calories? (Part 4)

It’s been a while since I last wrote about my Running Cold Experiment and in that time I’ve completed several more trials. See Part 1, Part 2, and Part 3. Here’s what they look like:

Data

trial6data

Revisiting my methodology

More interestingly, I discovered another issue with my methodology, again having to do with the fact that I only get minute-level resolution on my calories and METs, while most of my runs finish somewhere between the 10:30 and 11 minute mark.

I returned to the raw data in order to modify the Average METs and Calories Burned measurements for Trials 3 and 4 to include the 11th minute (they didn’t before, in previous posts). I did this because I thought it more appropriate to include the 11th minute in the calculations for Trials 5 and 6 because they were much closer to the 11 minute duration mark than the 10 minute mark, and I wanted to keep all the trials as consistent as possible.

But I am realizing that this is still problematic, and I needed some help to figure it out. There were some important things I needed to understand about how BodyMedia records their data in order to improve my methodology for how to record the samples.

So the problem is this: if I cut the data off at 10 minutes for the purposes of comparison, I effectively introduce a new variable to the experiment, which is the distance I run. It would make it different for each trial.

But if I include the 11th minute, that is problematic as well because it includes a substantial amount of cooldown time for my faster runs, which negatively impacts the average calories and METs for the run.

I was also noticing that when I looked at the data points closely and attempted to run my own averages, I was getting different numbers than what BodyMedia was calculating. Something just seemed to be off.

So I wrote to BodyMedia about the issue, and they took the time to write me a wonderfully detailed response to help me understand the finer points of how the armband works, and gave some good suggestions for making my experiment more rigorous.

Help from BodyMedia

Here are paraphrases of my questions and their response:

Me: I’m getting different averages from my manual calculations than what I see displayed in BodyMedia’s Activity Manager for the same period. Am I doing something wrong?

BodyMedia: Energy expenditure values represent the value over the minute. See the attached document [Nick: see “Feature Generation” on the page marked 1616] for how the sensors are sampled over the minute.

[Nick: in other words, when a calorie value is displayed for 5:34pm, it is the sum of the calories that were burned from the start to 5:33pm to the start of 5:34pm. It shows the calorie burn over the previous minute. Up to now I had been looking at it the other way, that 5:34pm would mean the start of 5:34pm until the start of 5:35pm. This explains why my calculations were off and everything immediately started matching up once I fixed it]

Me: Since I only get by-minute resolution, how can I deal with device synchronization issues (i.e. 5:34pm on my phone probably started before or after 5:34pm on my BodyMedia armband, so how do I know I’m looking at the appropriate time range on each device)?

BodyMedia: Minute resolution for energy expenditure is all that is available for Activity Manager.  SenseWear [BodyMedia’s enterprise version of the product designed for clinicians and their patients] users can set from 32Hz to 10 minute granularity…

Standard experimental procedure would have you avoid end effects by not using end data points. I would suggest using the 8 minutes of steady state data. If you want 10 minutes of data for your analysis, record for 12 minutes.

I start and end a lot of my experiments with 2 minutes of no steps. This helps me identify the boundaries of the test. You are guaranteed to get one minute of no steps in your data file (minimal energy expenditure) and I do not use that minute or neighboring minutes.  2 minutes on your watch give one full minute of  no steps and minimal Calories in the data because of any misalignment between the armband time and your watch time.

Action Items

This information really helped me to focus the experiment:

  1. Revisit my BodyMedia data to make sure I am referencing the right time frame (i.e. timestamp 5:35pm = what happened between 5:34 and 5:35, not 5:35 and 5:36)
  2. Start standing still for 2 minutes of no steps immediately before and after my run in order to help delimit it in the data
  3. Start excluding the first and last minute of the run in my data. In other words, look at my shortest run, take the time frame that starts in minute 2 and ends in the second to last minute, and apply that time frame to all of the trials. This will help to get the best consistency. Fortunately I still have all my raw data so I can go back and adjust my existing metrics.

Next: See Part 5 where I start to make some comparisons across runs.

Experiment: Does Running in Cold Weather Make Me Burn More Calories? (Part 3)

Trial 3 of my Running Cold Experiment has brought with it some new insights. Each trial seems to help me rethink how to best capture the data I need. (Read Part 1 and Part 2).

I’ve decided that I am in an early phase where I am still defining the experiment. I will most likely need to throw out my first few data points as I continue to refine the process which should lead to better results. The alternative would be to lock in an inferior experimental method, which I think is far less desirable. That said, I am running out of cold days! So there is some time pressure to get it right.

New Metrics

I don’t yet know what all the factors are that may or may not have an effect on my runs. So for a while I am going to collect as many additional metrics as possible to help control for them. To that end, I discovered a new resource for weather data at wunderground.com.

I am hoping that once I have data from enough trials I will be able to account for things like wind speed and humidity by running some regression analyses, although I don’t currently know what is the minimum amount of data needed to do that with any sort of statistical rigor (I’ll research it once I’m closer).

I can say that qualitatively they have not had a noticeable effect, unless they contribute to making it feel warmer or colder than it actually is outside (likely). I haven’t noticed the wind much except in my latest Trial (Trial 3, today), between markers 2 and 4.

Data

Trial 3 Results

trial3data

Observations

It is proving harder than I thought to stay consistent with my run times. I started out too fast in Trial 3 and reached Marker 2 thirty seconds early. Then I slowed down to try to compensate, but ultimately ended up finishing 15 seconds faster than Trial 2, which was already faster than Trial 1. Under normal circumstances this would be encouraging as it indicates progress in terms of physical fitness, but in the context of this experiment I need to try harder to maintain consistency.

I suppose one way to look at it is to try to separate my exercise from my experiment. Another option would be to throw out Trial 1 and use Trial 3 as my new baseline. Right now it is far more appealing to just throw out my early data so that I am not constrained into the run time I established when I was less in shape. I will try to modify my runs to focus at a new target run time, which it may take me a few more runs to identify.

A Solution to Trial 2‘s Data Recording Problem: A New Metric

I have a Display Device that wirelessly communicates with my BodyMedia armband to give me real-time readings of steps taken and calorie burn. I don’t normally bother with it, but this time I took it with me and monitored the trip pedometer to make sure that the device was recording throughout my run. I don’t expect the metric to be very useful beyond ensuring the device is working since the approximate number of steps I take in the mile should not vary much, but I am a fan of collecting more data than I think I’ll need.

A Note about Heart Rate

I have been bad about recording my heart rate immediately after my run. So far I have been recording it at 6 or so minutes after I stop running but it varies, and it’s enough time for my heart rate to come down significantly before it is measured, so I am not confident in the consistency of this metric.

Part of this is because of limitations with the tool I am using (Azumio Instant Heart Rate): it doesn’t measure very well when my fingers are cold; there is even a warning to that effect in the app itself. The way it works is that I place my finger over my phone’s camera, which uses the flash to light up my finger and measure slight changes in the color in order to detect my pulse. I expect that my heart rate readings will become more accurate as the weather temperature increases and I am able to take the reading more immediately after my run, or if I move to a new tool like a heart rate monitor that goes around the chest.

Preliminary Correlation?

One interesting (possible) correlation I’ve noticed so far is that it appears that a longer run duration makes me burn more calories, even though this indicates that I ran faster in that period (because the distance is equal). This is evident in the following data:

Trial # Calories Burned Run Duration
Trial 1 107 calories 11 mins (and change)
Trial 3 104 calories 10 mins, 35.4 seconds

So if this is a true correlation, that would indicate if my goal were purely to maximize calorie burn, I would be better off doing longer endurance exercises than shorter high intensity exercises. That said, I can’t yet tease out what impact temperature or any of the other factors might also be having.

Once again, I have a fever and the only prescription is more data.

See Part 4 where I revise my methodology as a result of some good advice.

Experiment: Does Running in Cold Weather Make Me Burn More Calories? (Part 1)

I just completed the first trial of my Running Cold experiment and have some preliminary results!

I had previously defined my plan for the experiment at the end of this post.

Weather/Temperature

Here’s the weather info for today, according to Google:

Cold Experiment Weather

Attire

For the run I wore a pair of running pants, tennis shoes, a black T-shirt, and a black ski hat to cover my ears (I get headaches if I’m in the cold with my ears uncovered). Once the weather gets warmer, I’ll stop wearing the hat, but other than that I’ll make sure my attire remains the same across trials.

Continue reading “Experiment: Does Running in Cold Weather Make Me Burn More Calories? (Part 1)” »

4 Months of Calorie Burn: What Have I Learned So Far?

I now have over 4 months of BodyMedia calorie burn data:

Nov 2012 Daily Average: 2,205
Dec 2012 Daily Average: 2,123
Jan 2013 Daily Average: 2,183
Feb 2013 Daily Average: 2,114

The average seems to be going down. Why?

Is this the result of changing habits, a change in seasons, or just pure dumb luck?

Continue reading “4 Months of Calorie Burn: What Have I Learned So Far?” »

Biometrics of Snow Shoveling

The following post is excerpted from an email conversation with my friend Linda Hasenmyer.


Hi Linda,

So, for the last year or so I’ve been on this Quantified Self kick. One of the things I do is wear a calorie tracker gadget which measures, among other things, the calories I burn on a minute-by-minute basis. Every few days or weeks I check my data and try to see what I can learn, and try to adjust my behavior accordingly.

Today I was reviewing my data and remembered the conversation we had last week about calorie burn with regard to rowing and snow shoveling, so I thought I’d share with you what I found.

Continue reading “Biometrics of Snow Shoveling” »