Experiment: Does Running in Cold Weather Make Me Burn More Calories? (Part 5)

I’ve just discovered something really interesting in my last few runs (from my Running Cold Experiment, see Part 1Part 2Part 3, Part 4) that I may not have noticed had I not implemented BodyMedia’s suggested methodology. Check this out:

Here was Trial 9 (today from 7:20-7:30, at a WARM 62ºF) with a little extra data on either side. Notice how quickly the chart falls back down to under 2 calories per minute once I stopped running at 7:30.

Trial 9 Chart

Now look at Trial 7 (4/14 from 3:08-3:18, at a WARM 61ºF). Again, notice the similar results, especially the fast dropoff after 3:18pm when I stopped running:

Trial 7 Chart

BUT now check out Trial 8 (4/19 from 3:52-4:02, at a COLD 37ºF). I stopped running at 4:02:

Trial 8 Chart

The dropoff on Trial 8 was not nearly so steep. The calorie burn continued to be elevated well after I stopped running. So although my maximum burn was not affected that much DURING the run, afterward I continued to burn calories at an accelerated rate.
These are only 3 data points, but I found this to be very interesting. It’s also something that would not show up in my regular data chart because I’m not including the cooldown data for this particular experiment. Could be something interesting to explore in the future. I just hope I get more cold days!

Experiment: Does Running in Cold Weather Make Me Burn More Calories? (Part 4)

It’s been a while since I last wrote about my Running Cold Experiment and in that time I’ve completed several more trials. See Part 1, Part 2, and Part 3. Here’s what they look like:

Data

trial6data

Revisiting my methodology

More interestingly, I discovered another issue with my methodology, again having to do with the fact that I only get minute-level resolution on my calories and METs, while most of my runs finish somewhere between the 10:30 and 11 minute mark.

I returned to the raw data in order to modify the Average METs and Calories Burned measurements for Trials 3 and 4 to include the 11th minute (they didn’t before, in previous posts). I did this because I thought it more appropriate to include the 11th minute in the calculations for Trials 5 and 6 because they were much closer to the 11 minute duration mark than the 10 minute mark, and I wanted to keep all the trials as consistent as possible.

But I am realizing that this is still problematic, and I needed some help to figure it out. There were some important things I needed to understand about how BodyMedia records their data in order to improve my methodology for how to record the samples.

So the problem is this: if I cut the data off at 10 minutes for the purposes of comparison, I effectively introduce a new variable to the experiment, which is the distance I run. It would make it different for each trial.

But if I include the 11th minute, that is problematic as well because it includes a substantial amount of cooldown time for my faster runs, which negatively impacts the average calories and METs for the run.

I was also noticing that when I looked at the data points closely and attempted to run my own averages, I was getting different numbers than what BodyMedia was calculating. Something just seemed to be off.

So I wrote to BodyMedia about the issue, and they took the time to write me a wonderfully detailed response to help me understand the finer points of how the armband works, and gave some good suggestions for making my experiment more rigorous.

Help from BodyMedia

Here are paraphrases of my questions and their response:

Me: I’m getting different averages from my manual calculations than what I see displayed in BodyMedia’s Activity Manager for the same period. Am I doing something wrong?

BodyMedia: Energy expenditure values represent the value over the minute. See the attached document [Nick: see “Feature Generation” on the page marked 1616] for how the sensors are sampled over the minute.

[Nick: in other words, when a calorie value is displayed for 5:34pm, it is the sum of the calories that were burned from the start to 5:33pm to the start of 5:34pm. It shows the calorie burn over the previous minute. Up to now I had been looking at it the other way, that 5:34pm would mean the start of 5:34pm until the start of 5:35pm. This explains why my calculations were off and everything immediately started matching up once I fixed it]

Me: Since I only get by-minute resolution, how can I deal with device synchronization issues (i.e. 5:34pm on my phone probably started before or after 5:34pm on my BodyMedia armband, so how do I know I’m looking at the appropriate time range on each device)?

BodyMedia: Minute resolution for energy expenditure is all that is available for Activity Manager.  SenseWear [BodyMedia’s enterprise version of the product designed for clinicians and their patients] users can set from 32Hz to 10 minute granularity…

Standard experimental procedure would have you avoid end effects by not using end data points. I would suggest using the 8 minutes of steady state data. If you want 10 minutes of data for your analysis, record for 12 minutes.

I start and end a lot of my experiments with 2 minutes of no steps. This helps me identify the boundaries of the test. You are guaranteed to get one minute of no steps in your data file (minimal energy expenditure) and I do not use that minute or neighboring minutes.  2 minutes on your watch give one full minute of  no steps and minimal Calories in the data because of any misalignment between the armband time and your watch time.

Action Items

This information really helped me to focus the experiment:

  1. Revisit my BodyMedia data to make sure I am referencing the right time frame (i.e. timestamp 5:35pm = what happened between 5:34 and 5:35, not 5:35 and 5:36)
  2. Start standing still for 2 minutes of no steps immediately before and after my run in order to help delimit it in the data
  3. Start excluding the first and last minute of the run in my data. In other words, look at my shortest run, take the time frame that starts in minute 2 and ends in the second to last minute, and apply that time frame to all of the trials. This will help to get the best consistency. Fortunately I still have all my raw data so I can go back and adjust my existing metrics.

Next: See Part 5 where I start to make some comparisons across runs.

Experiment: Does Running in Cold Weather Make Me Burn More Calories? (Part 3)

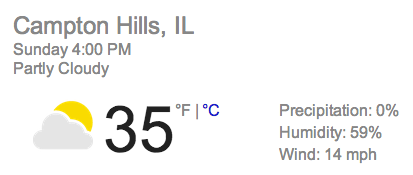
Trial 3 of my Running Cold Experiment has brought with it some new insights. Each trial seems to help me rethink how to best capture the data I need. (Read Part 1 and Part 2).

I’ve decided that I am in an early phase where I am still defining the experiment. I will most likely need to throw out my first few data points as I continue to refine the process which should lead to better results. The alternative would be to lock in an inferior experimental method, which I think is far less desirable. That said, I am running out of cold days! So there is some time pressure to get it right.

New Metrics

I don’t yet know what all the factors are that may or may not have an effect on my runs. So for a while I am going to collect as many additional metrics as possible to help control for them. To that end, I discovered a new resource for weather data at wunderground.com.

I am hoping that once I have data from enough trials I will be able to account for things like wind speed and humidity by running some regression analyses, although I don’t currently know what is the minimum amount of data needed to do that with any sort of statistical rigor (I’ll research it once I’m closer).

I can say that qualitatively they have not had a noticeable effect, unless they contribute to making it feel warmer or colder than it actually is outside (likely). I haven’t noticed the wind much except in my latest Trial (Trial 3, today), between markers 2 and 4.

Data

Trial 3 Results

trial3data

Observations

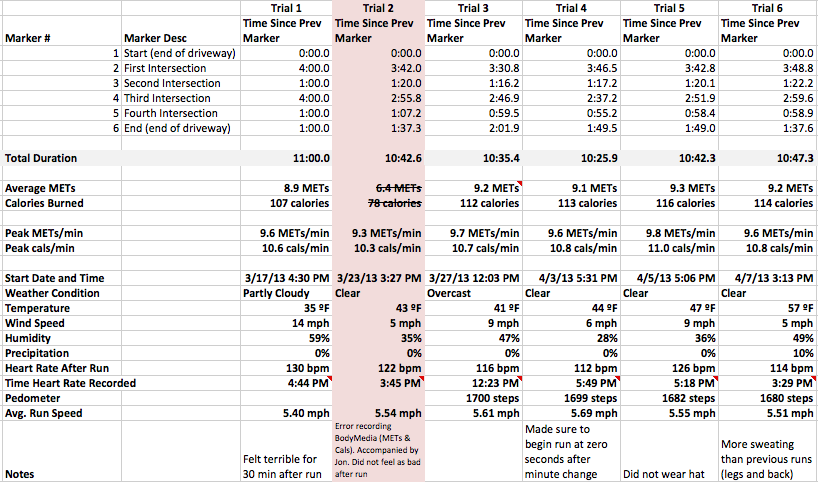
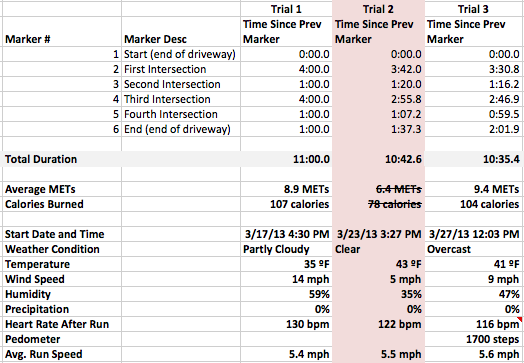
It is proving harder than I thought to stay consistent with my run times. I started out too fast in Trial 3 and reached Marker 2 thirty seconds early. Then I slowed down to try to compensate, but ultimately ended up finishing 15 seconds faster than Trial 2, which was already faster than Trial 1. Under normal circumstances this would be encouraging as it indicates progress in terms of physical fitness, but in the context of this experiment I need to try harder to maintain consistency.

I suppose one way to look at it is to try to separate my exercise from my experiment. Another option would be to throw out Trial 1 and use Trial 3 as my new baseline. Right now it is far more appealing to just throw out my early data so that I am not constrained into the run time I established when I was less in shape. I will try to modify my runs to focus at a new target run time, which it may take me a few more runs to identify.

A Solution to Trial 2‘s Data Recording Problem: A New Metric

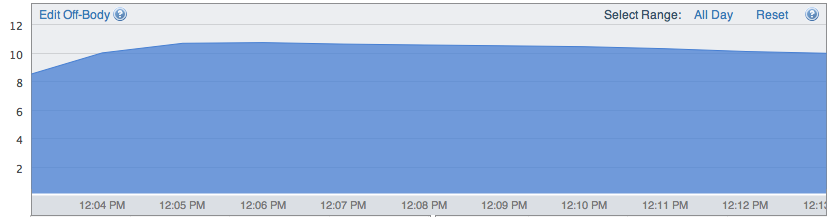
I have a Display Device that wirelessly communicates with my BodyMedia armband to give me real-time readings of steps taken and calorie burn. I don’t normally bother with it, but this time I took it with me and monitored the trip pedometer to make sure that the device was recording throughout my run. I don’t expect the metric to be very useful beyond ensuring the device is working since the approximate number of steps I take in the mile should not vary much, but I am a fan of collecting more data than I think I’ll need.

A Note about Heart Rate

I have been bad about recording my heart rate immediately after my run. So far I have been recording it at 6 or so minutes after I stop running but it varies, and it’s enough time for my heart rate to come down significantly before it is measured, so I am not confident in the consistency of this metric.

Part of this is because of limitations with the tool I am using (Azumio Instant Heart Rate): it doesn’t measure very well when my fingers are cold; there is even a warning to that effect in the app itself. The way it works is that I place my finger over my phone’s camera, which uses the flash to light up my finger and measure slight changes in the color in order to detect my pulse. I expect that my heart rate readings will become more accurate as the weather temperature increases and I am able to take the reading more immediately after my run, or if I move to a new tool like a heart rate monitor that goes around the chest.

Preliminary Correlation?

One interesting (possible) correlation I’ve noticed so far is that it appears that a longer run duration makes me burn more calories, even though this indicates that I ran faster in that period (because the distance is equal). This is evident in the following data:

Trial # Calories Burned Run Duration
Trial 1 107 calories 11 mins (and change)
Trial 3 104 calories 10 mins, 35.4 seconds

So if this is a true correlation, that would indicate if my goal were purely to maximize calorie burn, I would be better off doing longer endurance exercises than shorter high intensity exercises. That said, I can’t yet tease out what impact temperature or any of the other factors might also be having.

Once again, I have a fever and the only prescription is more data.

See Part 4 where I revise my methodology as a result of some good advice.

Experiment: Does Running in Cold Weather Make Me Burn More Calories? (Part 2)

I did a second test of my Running Cold Experiment last Saturday afternoon! Methodology was the same as Trial 1, with similar conditions, although about 8 degrees warmer.

Qualitative Data: Thoughts on Motivation and Level of Physical Fitness

I’m a bit ashamed to say that Trial 1 where I finished the mil at 11 minutes was one of my faster miles up to that point. Only a few times had I ever completed a full mile run without walking part of it.

BUT on Trial 1, my main motivation was that it was COLD. The run was very chilly at 35 degrees, which helped motivate me to push onward (and how!).

For Trial 2, it was still cold but not quite as bad, and this time my main motivation to push onward was that my brother joined me on the run, which always adds a bit of a competitive element. Although the time spent running on Trial 2 was 30 to 60 seconds shorter than Trial 1, Trial 2 felt less laborious.

After running Trial 1, I felt pretty sick for about 30 minutes afterward. This is probably because I hadn’t done much running in a long time! I recovered significantly faster and felt better after Trial 2, and was much less sore the next day, as compared with Trial 1.

I know this is not because of lowered output because I actually made better time on Trial 2. A possible explanation is that my endurance improved after the first Trial. It doesn’t seem like I should notice such a marked improvement so fast after just one run.

I don’t know what that might mean for the experiment though, because my physical condition is another factor that could potentially influence the MET and calorie measures I am tracking. In the future I will be adding Heart Rate to the metrics I track in the hope that I can use it to help control for physical fitness level.

Continue reading “Experiment: Does Running in Cold Weather Make Me Burn More Calories? (Part 2)” »

Experiment: Does Running in Cold Weather Make Me Burn More Calories? (Part 1)

I just completed the first trial of my Running Cold experiment and have some preliminary results!

I had previously defined my plan for the experiment at the end of this post.

Weather/Temperature

Here’s the weather info for today, according to Google:

Cold Experiment Weather

Attire

For the run I wore a pair of running pants, tennis shoes, a black T-shirt, and a black ski hat to cover my ears (I get headaches if I’m in the cold with my ears uncovered). Once the weather gets warmer, I’ll stop wearing the hat, but other than that I’ll make sure my attire remains the same across trials.

Continue reading “Experiment: Does Running in Cold Weather Make Me Burn More Calories? (Part 1)” »

4 Months of Calorie Burn: What Have I Learned So Far?

I now have over 4 months of BodyMedia calorie burn data:

Nov 2012 Daily Average: 2,205
Dec 2012 Daily Average: 2,123
Jan 2013 Daily Average: 2,183
Feb 2013 Daily Average: 2,114

The average seems to be going down. Why?

Is this the result of changing habits, a change in seasons, or just pure dumb luck?

Continue reading “4 Months of Calorie Burn: What Have I Learned So Far?” »