I did a second test of my Running Cold Experiment last Saturday afternoon! Methodology was the same as Trial 1, with similar conditions, although about 8 degrees warmer.
Qualitative Data: Thoughts on Motivation and Level of Physical Fitness
I’m a bit ashamed to say that Trial 1 where I finished the mil at 11 minutes was one of my faster miles up to that point. Only a few times had I ever completed a full mile run without walking part of it.
BUT on Trial 1, my main motivation was that it was COLD. The run was very chilly at 35 degrees, which helped motivate me to push onward (and how!).
For Trial 2, it was still cold but not quite as bad, and this time my main motivation to push onward was that my brother joined me on the run, which always adds a bit of a competitive element. Although the time spent running on Trial 2 was 30 to 60 seconds shorter than Trial 1, Trial 2 felt less laborious.
After running Trial 1, I felt pretty sick for about 30 minutes afterward. This is probably because I hadn’t done much running in a long time! I recovered significantly faster and felt better after Trial 2, and was much less sore the next day, as compared with Trial 1.
I know this is not because of lowered output because I actually made better time on Trial 2. A possible explanation is that my endurance improved after the first Trial. It doesn’t seem like I should notice such a marked improvement so fast after just one run.
I don’t know what that might mean for the experiment though, because my physical condition is another factor that could potentially influence the MET and calorie measures I am tracking. In the future I will be adding Heart Rate to the metrics I track in the hope that I can use it to help control for physical fitness level.
Corrections and Adjustments
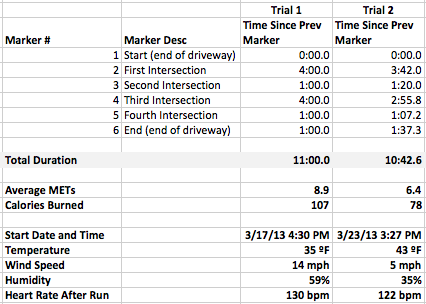
In reviewing my writeup of my first run, I noticed that I accidentally left out one of the markers, although it didn’t affect the total length of my run. I’ve included the omitted data point on the table below.
Also I used the iPhone stopwatch app to record the time to each Marker. That means it is more precise (it includes seconds). I realized that because I only recorded minutes on my first trial, the duration of that trial was probably somewhere between 11 and 12 minutes, as opposed to 11 on the dot. That discrepancy is worth noting, as short periods of time can have a fairly large impact when the full length of the trial is so short (1 minute ≈ 10%).
Data
Analysis
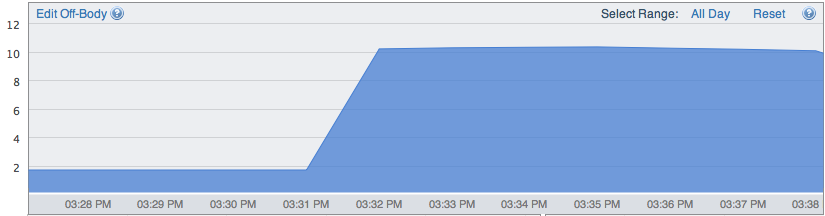
Oh no! Trial 2 has a problem. The BodyMedia armband seems not to have been recording for the first 4 minutes of the run. Normally it is designed to turn on automatically when it senses that I am wearing it. It actually looks like it wasn’t recording (there was a big flatline) from 1:46pm to 3:31pm even though I was wearing it all day. It must not have been on tight enough or was somehow situated wrong on my arm. This has lowered the average METs and total Calories recorded for the run.
I definitely have to throw out the data from Trial 2, but I think there may still be something I can learn from it. Let’s just look at the last 6 minutes from both Trials and compare the rest of the data to see what we get.
![]()
Trial 1 Sub-Time Range (Last 6 minutes):
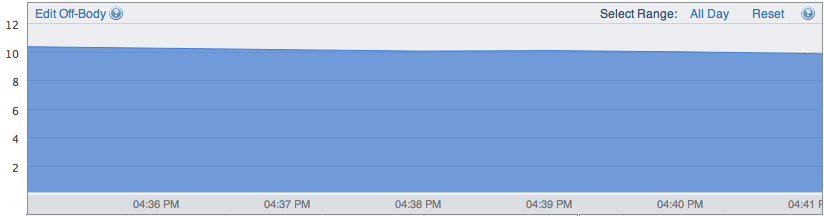
Trial 2 Sub-Time Range (Last 6 minutes):
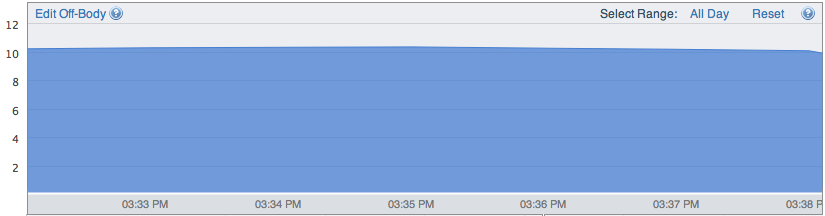
I am encouraged that the data that were collected appear to be comparable to what was expected (both trials had similar MET output and Calorie Burn).
The best solution is simply to collect more data. Although I am attempting to draw conclusions by comparing these two (flawed) trials, it is really too soon to say anything with certainty.
More data! I am finding this so much more motivating than “Oh, I should really run today.”
Next post in the series: Part 3.